

Why Price History Matters
A product listed at "40% off" looks compelling - until you discover the item has sat at that same discounted price for six consecutive months. Retailers routinely set elevated reference prices that make standard selling prices appear to be exceptional deals. If you want to know whether a price is genuinely low, you need historical context, not just today's tag.
This is especially relevant for big-ticket items: appliances, electronics, furniture, and sporting goods. These categories tend to follow predictable price cycles tied to model-year refreshes, holiday sales events, and inventory clearance. Understanding those cycles - covered in depth in our guide to seasonal price patterns - gives you a baseline before you even open a price tracker.
For a broader look at how reference pricing works against consumers, see why that sale price might not be a deal at all. The short version: the "was" price in a "was/now" label is often a number the item rarely, if ever, actually sold at.
What you will need
Step-by-Step: How to Check Price History
The process is straightforward. Follow these steps before committing to any significant purchase.
Identify the exact product model
Before looking up price history, confirm you have the precise model number or SKU. Retailers sometimes list near-identical products with slightly different configurations - different storage capacity, color, or bundle inclusions - each with its own price history. Using a vague search term can pull up the wrong data entirely.
Check the retailer's product page, the manufacturer's website, or the physical packaging to find the model identifier.
Run the product through a price history tool
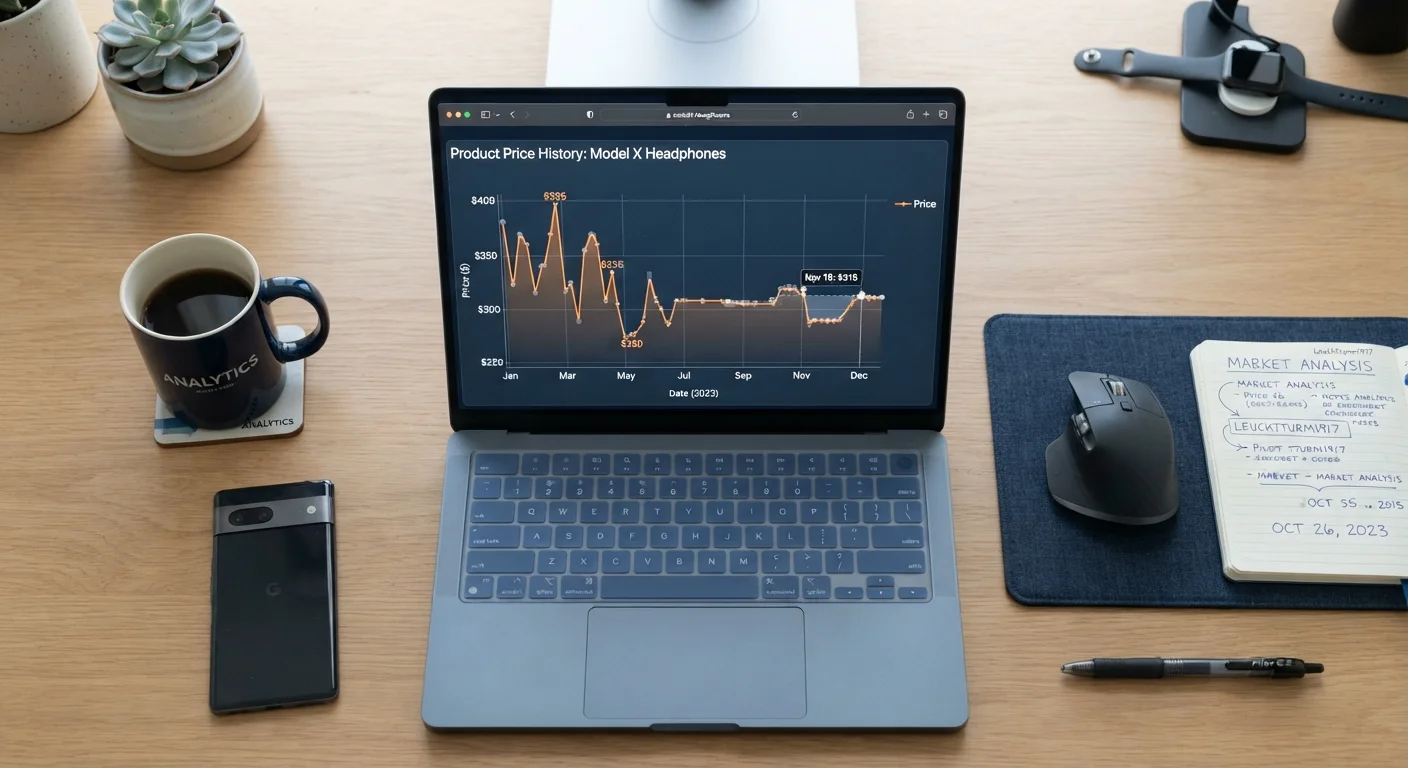
Enter the product name, model number, or the retailer's product URL into a price tracking tool. Most tools generate a line chart showing the price over the past 30, 90, or 365 days. Look for tools that cover the specific retailer you're shopping at - coverage varies by platform.
If a browser extension is installed, it may overlay this data automatically when you visit the product page. Either approach works; the data source matters more than the interface.
Set the date range to at least 90 days
A 30-day window can hide context. Many promotional cycles repeat on a 60-90 day schedule, so a price that looks unusually low over 30 days may actually be its standard level over three months. Extend the chart range to 90 days minimum; 12 months is preferable for seasonal items like outdoor equipment, holiday goods, or back-to-school products.
Note the all-time low and the 90-day average
Most price trackers display an all-time low alongside the current price. Record both figures. Then calculate (or note) the rough average price over the past 90 days. These two numbers tell you: (1) how much lower prices have gone before, and (2) what this item typically costs when it's not being promoted.
If the current price is at or very near the all-time low, that's meaningful. If it's above the 90-day average, the "sale" framing deserves skepticism.
Check price history across multiple retailers
A product may have a lower price history at one retailer than another. Run the same search across two or three major platforms where the item is available. This also helps you spot whether prices across retailers move in sync - which often indicates a manufacturer-suggested price that no one discounts much - or whether genuine competition creates real variation.
Decide: buy now, set an alert, or wait for a known cycle
With the data in hand, you have three rational options. If the current price is at or near a genuine historical low and you need the item soon, buying now is defensible. If prices have been lower before and may cycle down again, set a price alert for your target figure and wait. If the item falls into a category with predictable seasonal discounts - like televisions before major sports seasons or winter apparel in January - waiting for that window may produce a lower price than any alert will catch.
For more context on how product categories behave differently, see our hub on product categories and what to know before buying in each one.
Don't Skip the Seasonal Context
Price history tools show you what happened - but understanding why prices move requires category knowledge. Major sale events, product-cycle timing, and seasonal demand all shape the chart you're reading. Pairing raw price data with an understanding of when retailers actually mark things down makes your analysis significantly more accurate.
Interpreting What You Find
Raw price history data only helps if you know what you're looking at. Here's how to read the patterns:
- Flat line at the current price: The item has never been cheaper. Either it's genuinely priced fairly or demand is strong enough that discounts are rare.
- Frequent dips to this price or lower: Today's "sale" is routine. You can likely wait it out and find a similar price again - or lower - in weeks.
- One-time spike above the current price: The high reference price may have been set artificially and held briefly before returning to normal. This is a common tactic.
- Gradual downward trend: The product category or model is aging. Prices may continue to fall as newer versions approach.
Once you've assessed the chart, cross-reference your findings with the checklist for evaluating any online deal before clicking buy. Price is just one variable - shipping, return policy, and seller reputation all factor in.
If you're also thinking about whether this purchase fits your broader budget, reading your own spending patterns is a useful parallel exercise.
The content on this site is for informational purposes only and is not a substitute for professional advice. Always consult a qualified professional for guidance specific to your situation.